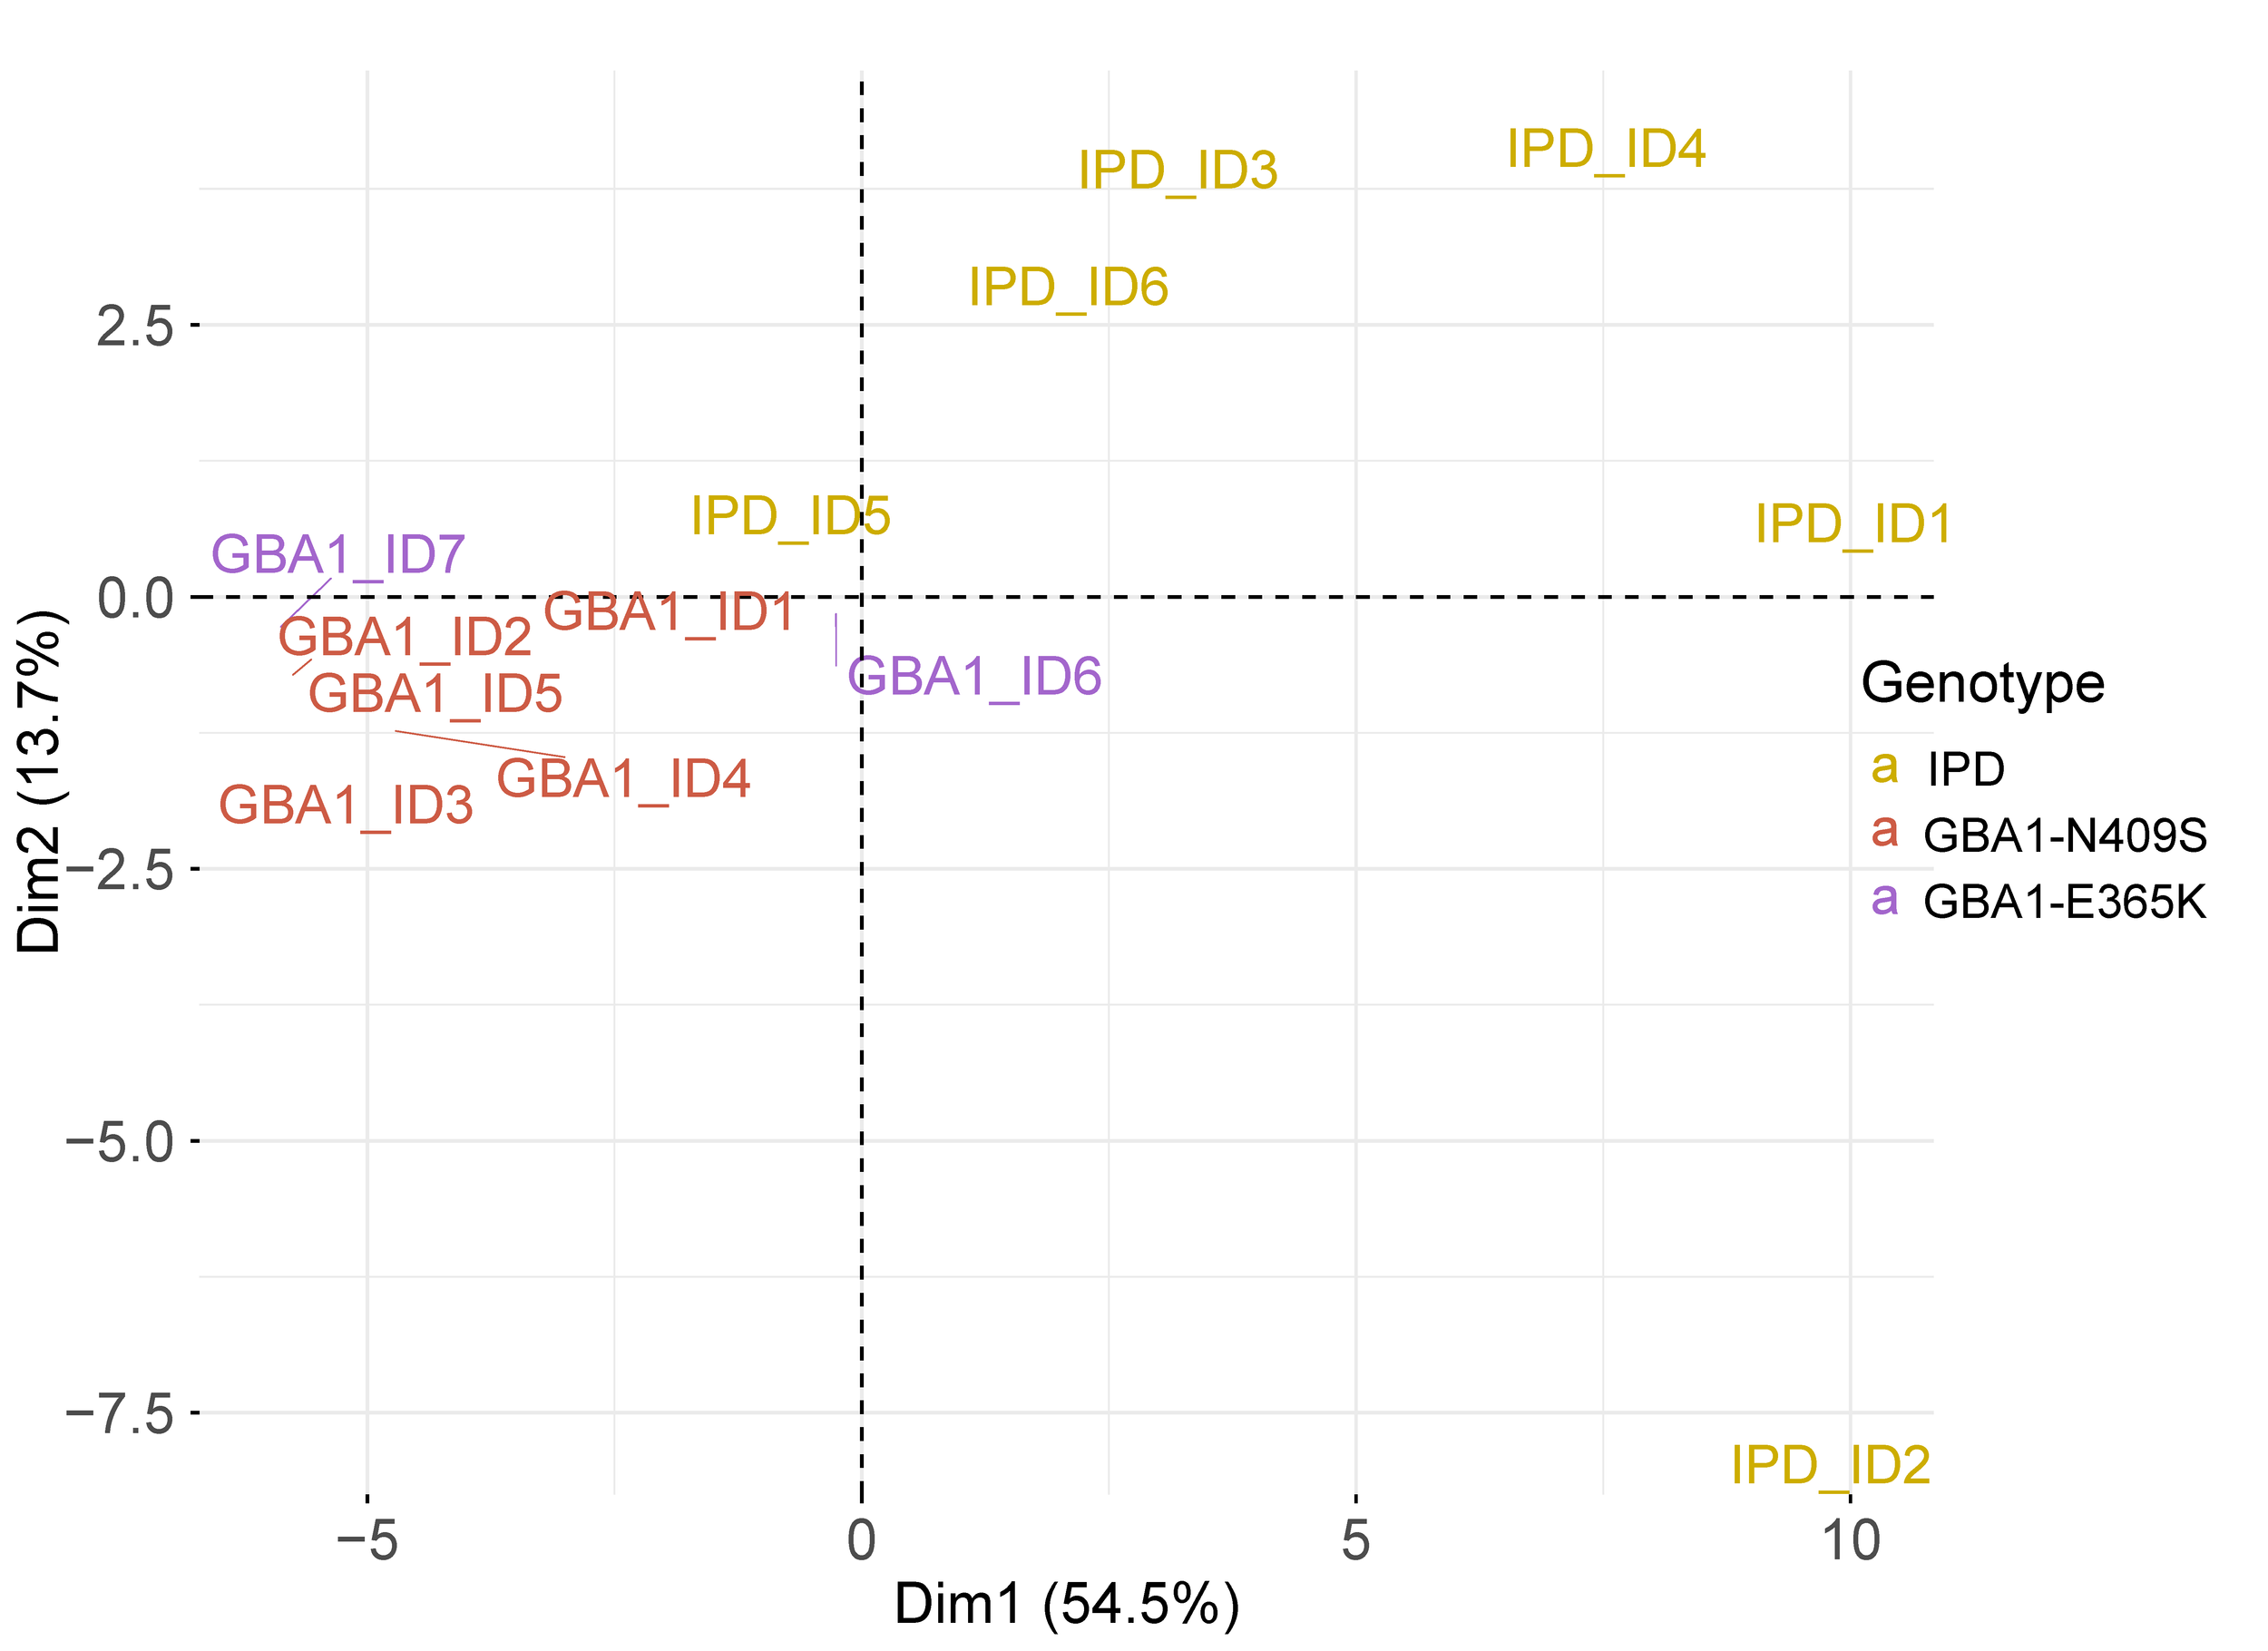
Patient stratification
Using our datasets, we can stratify patients depending on the phenotypes of their corresponding organoids. In the following panels, patients were stratified depending on the transcriptomic signatures of midbrain organoids generated from their iPSC lines.
Subtype stratification
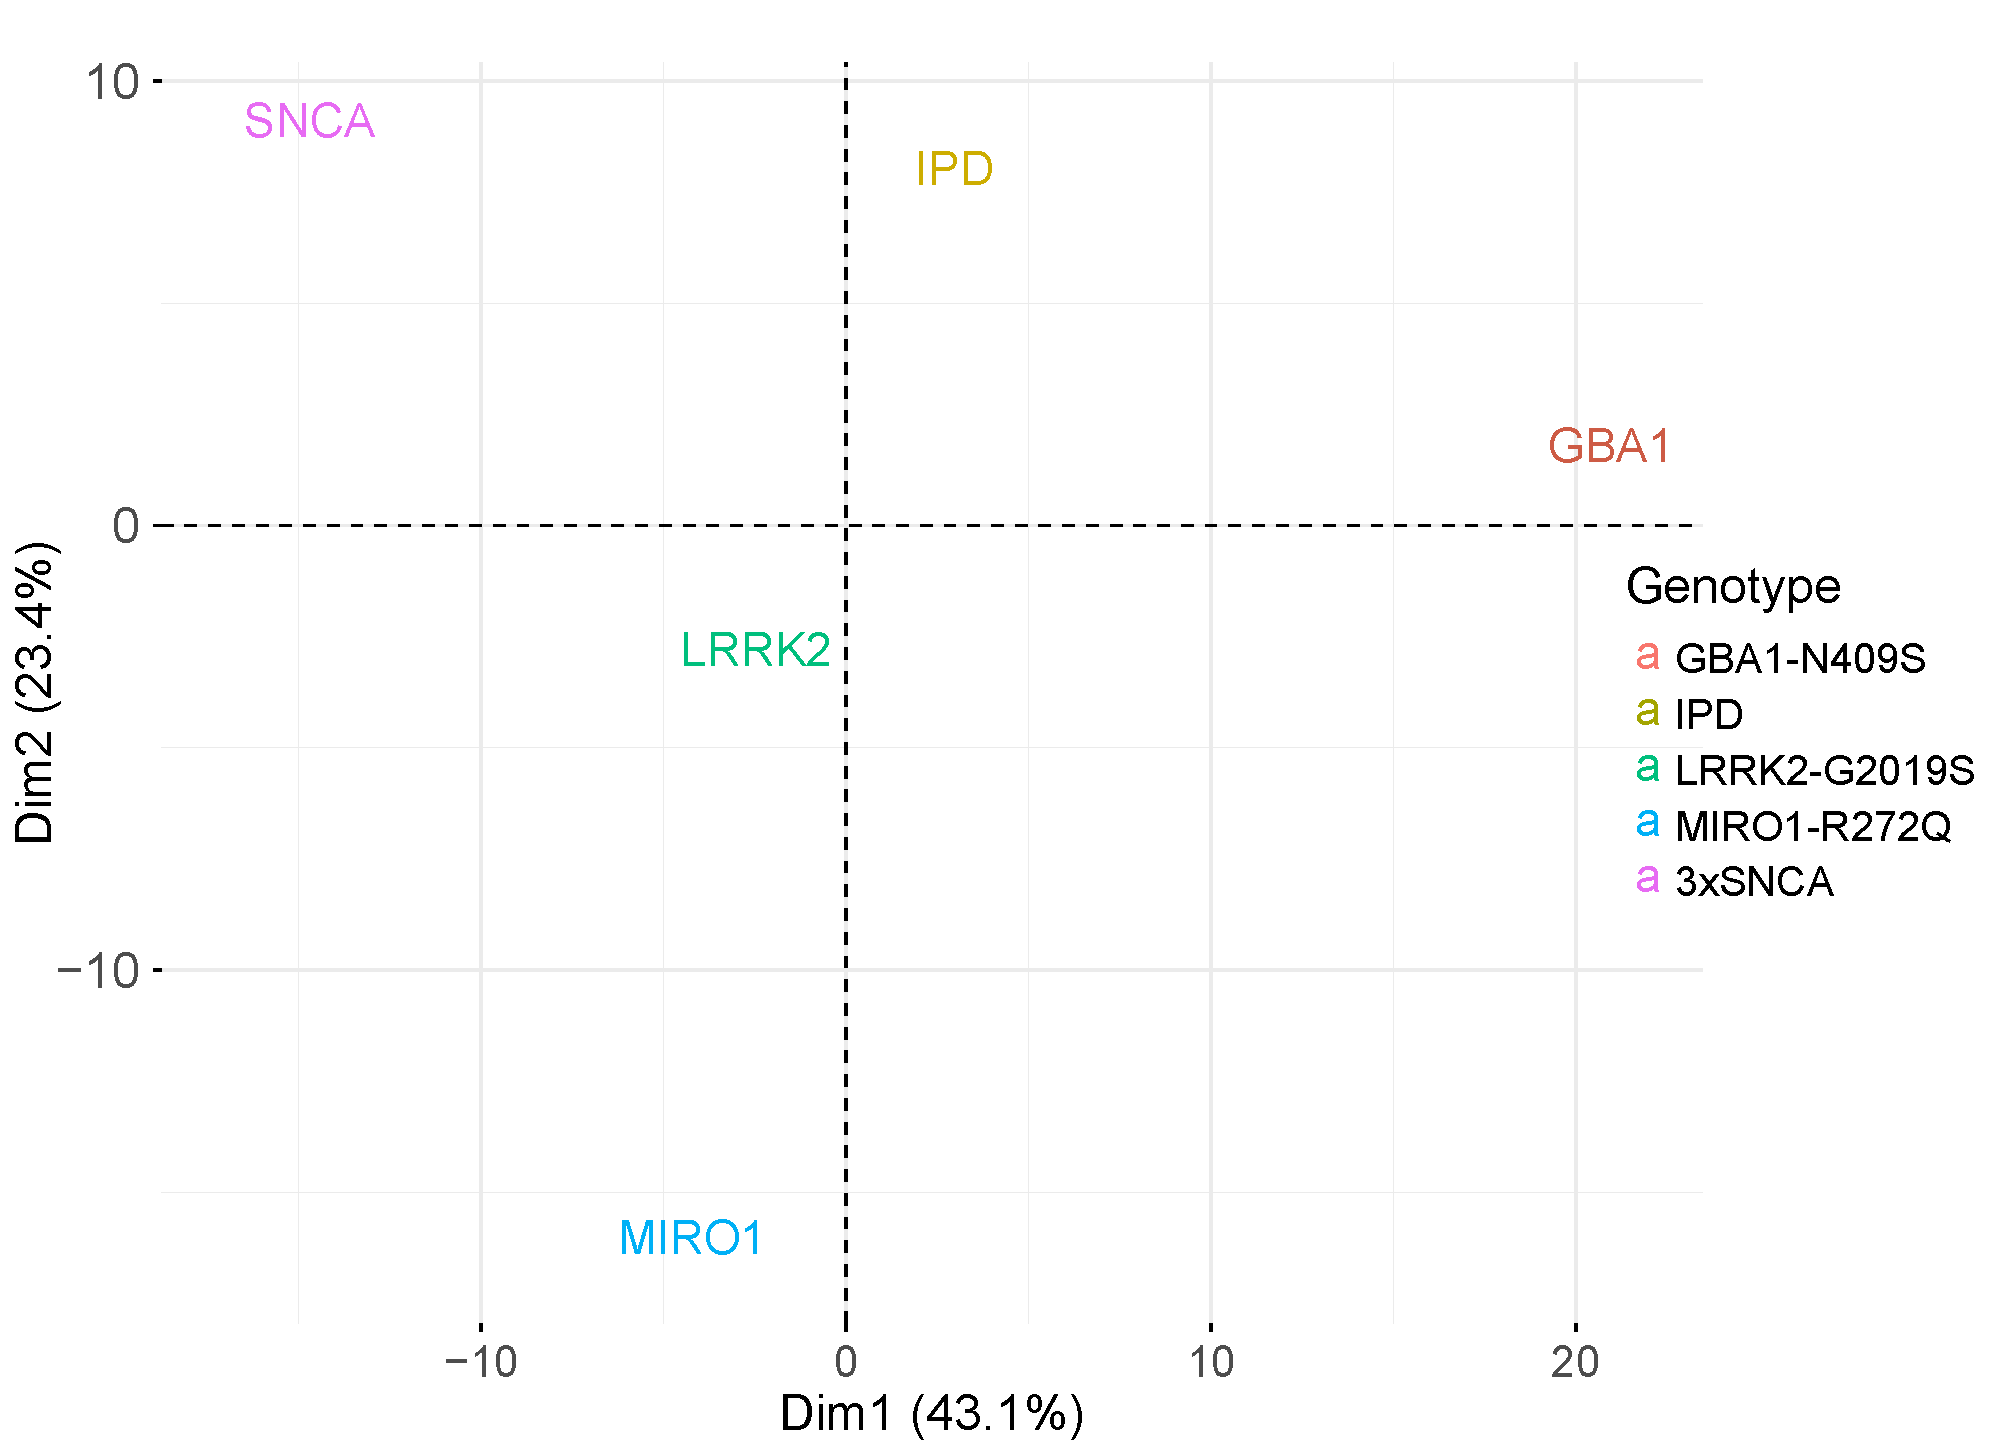
Transcriptomic signature similarities between PD monogenic and IPD cases.
Patient stratification
By using personalized patient organoid data, we stratify patients to understand clinical symptoms and predict the most effective treatment strategies.
Multi-modal data integration
Our PD Knowledge Graph (PD-KG) combines pre-existing results from high-content imaging and RNA-seq studies with information from public databases. The data integration pipeline is well described here.
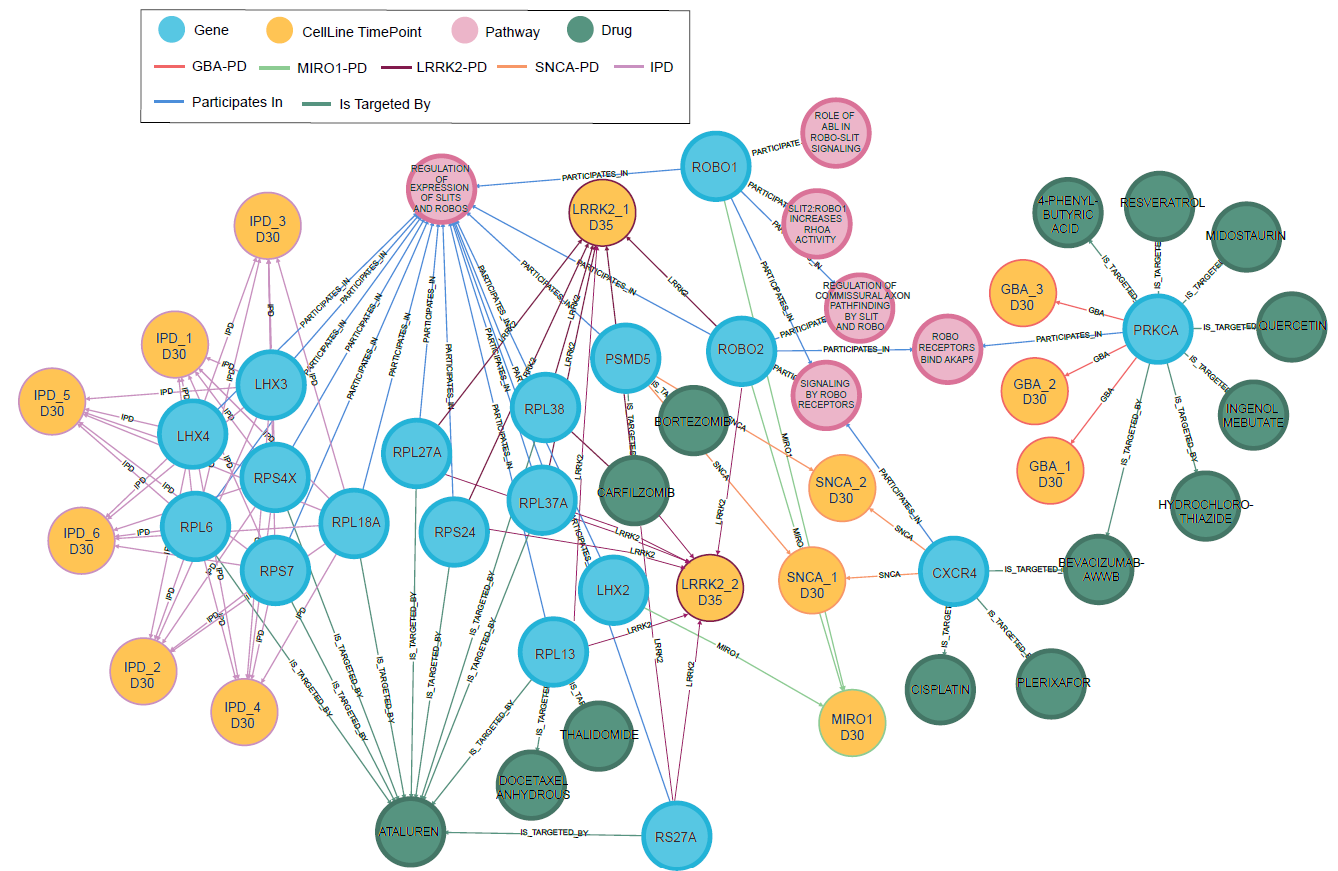
PD-KG: Node-level view
In the above example, we use PD-KG to identify common altered genes across different PD forms, highlighting potential candidates for drug repurposing and new therapeutics in PD. A full description of this research can be found here.
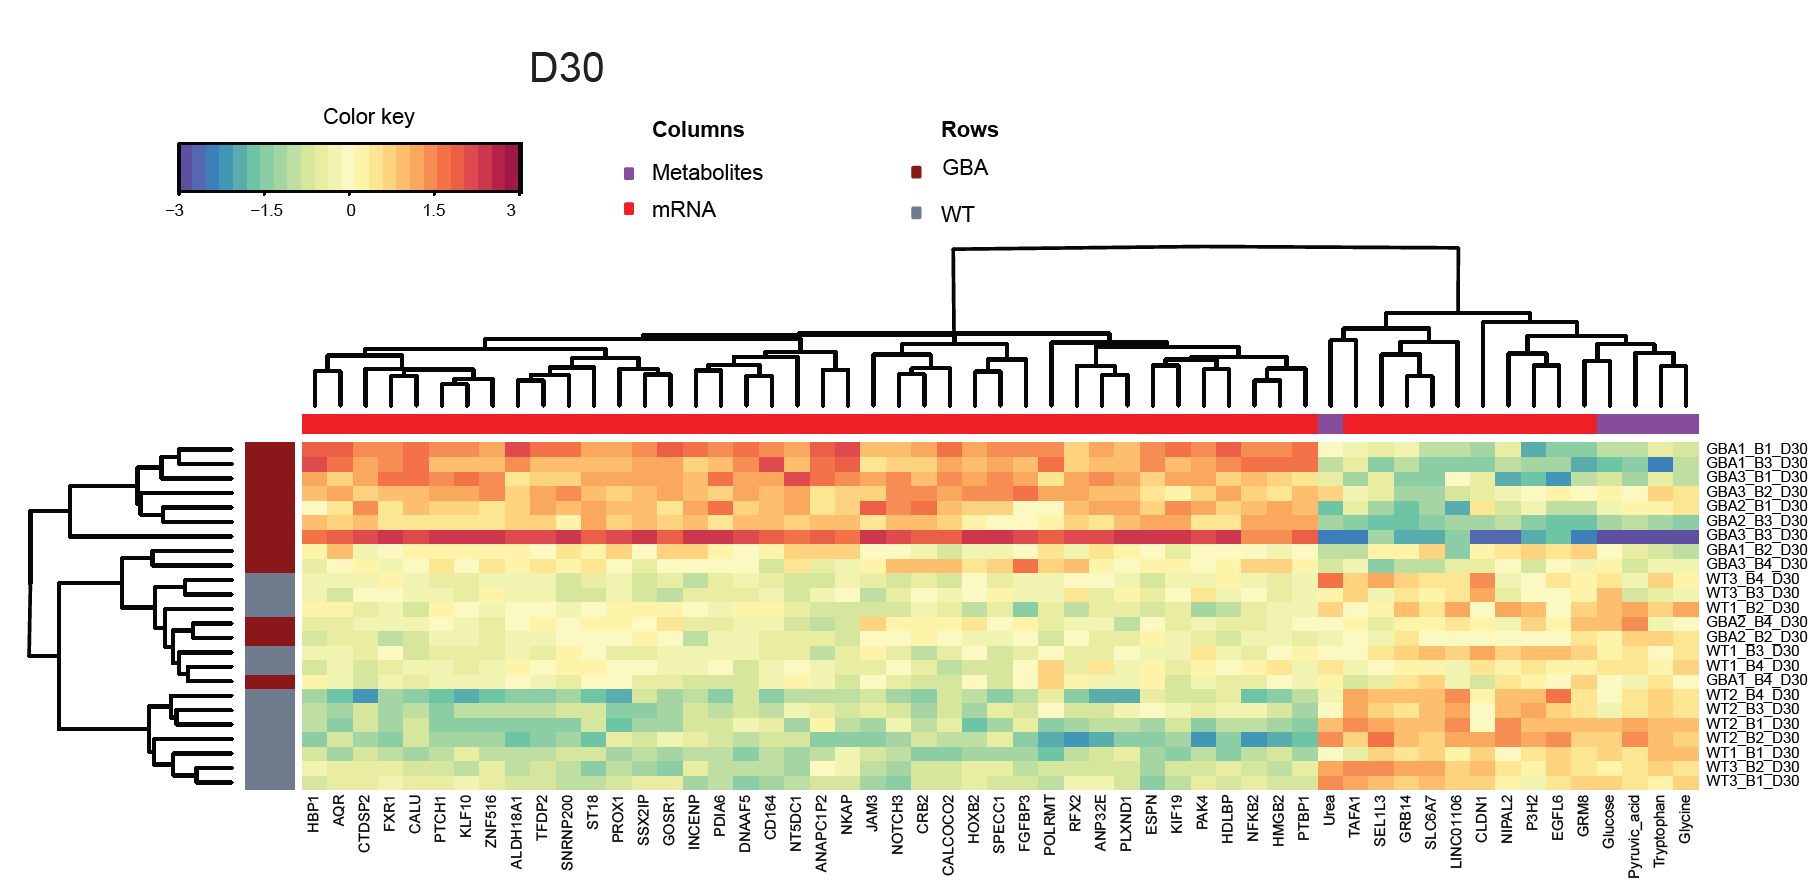
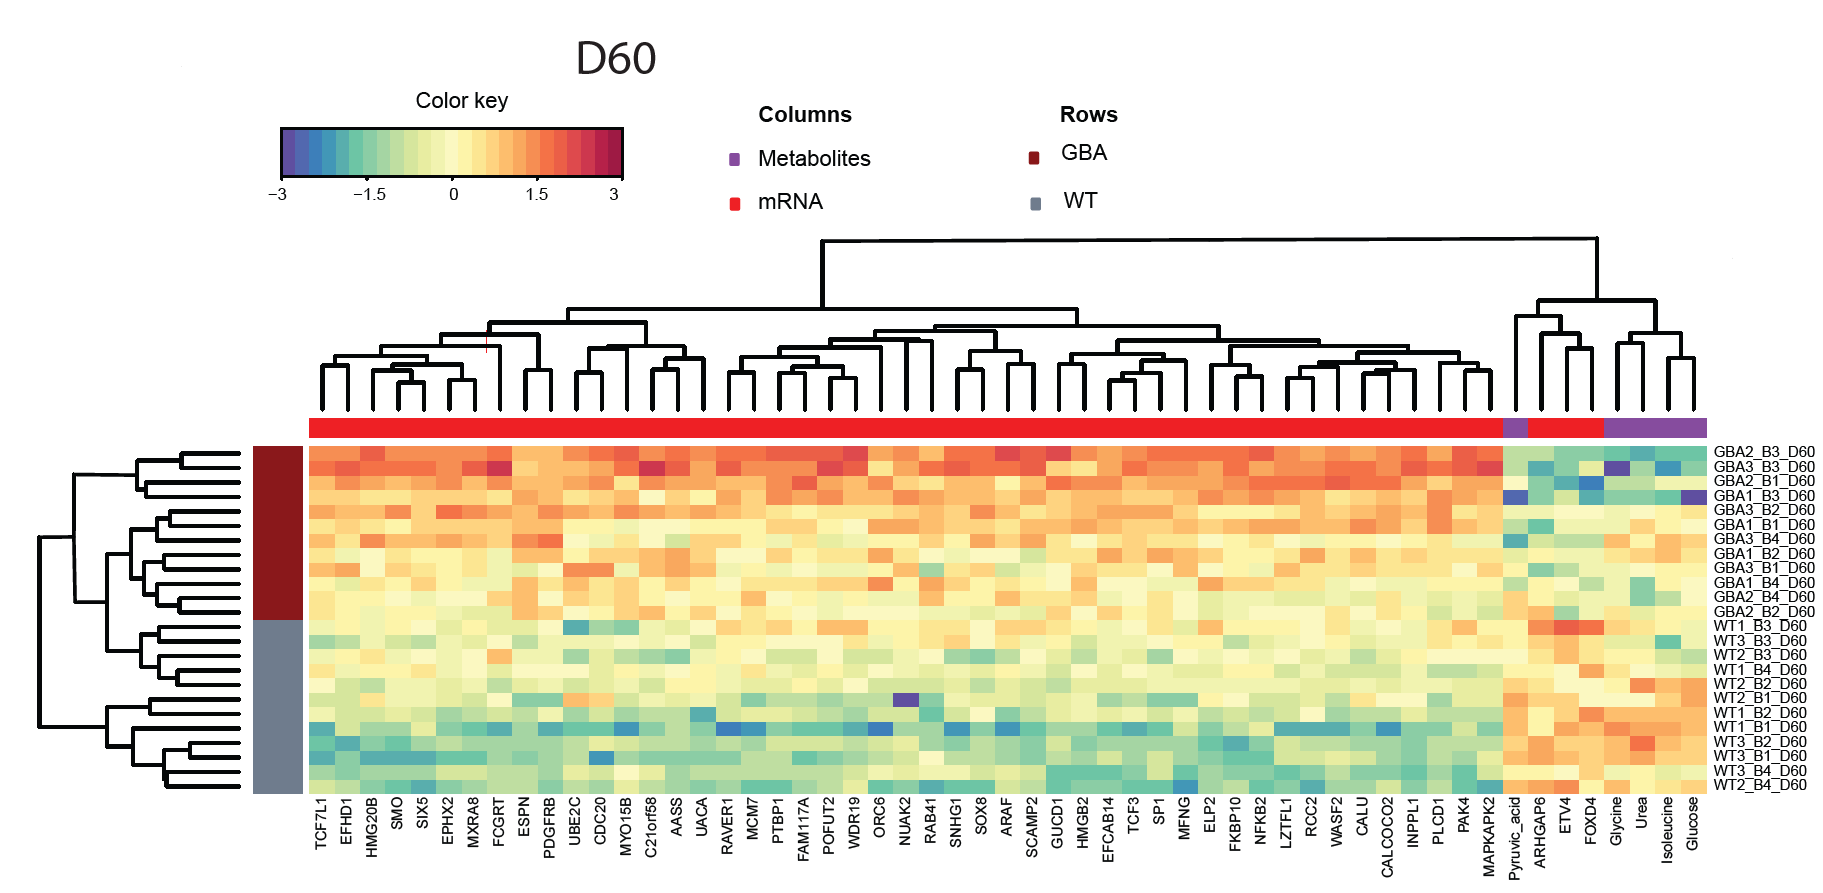
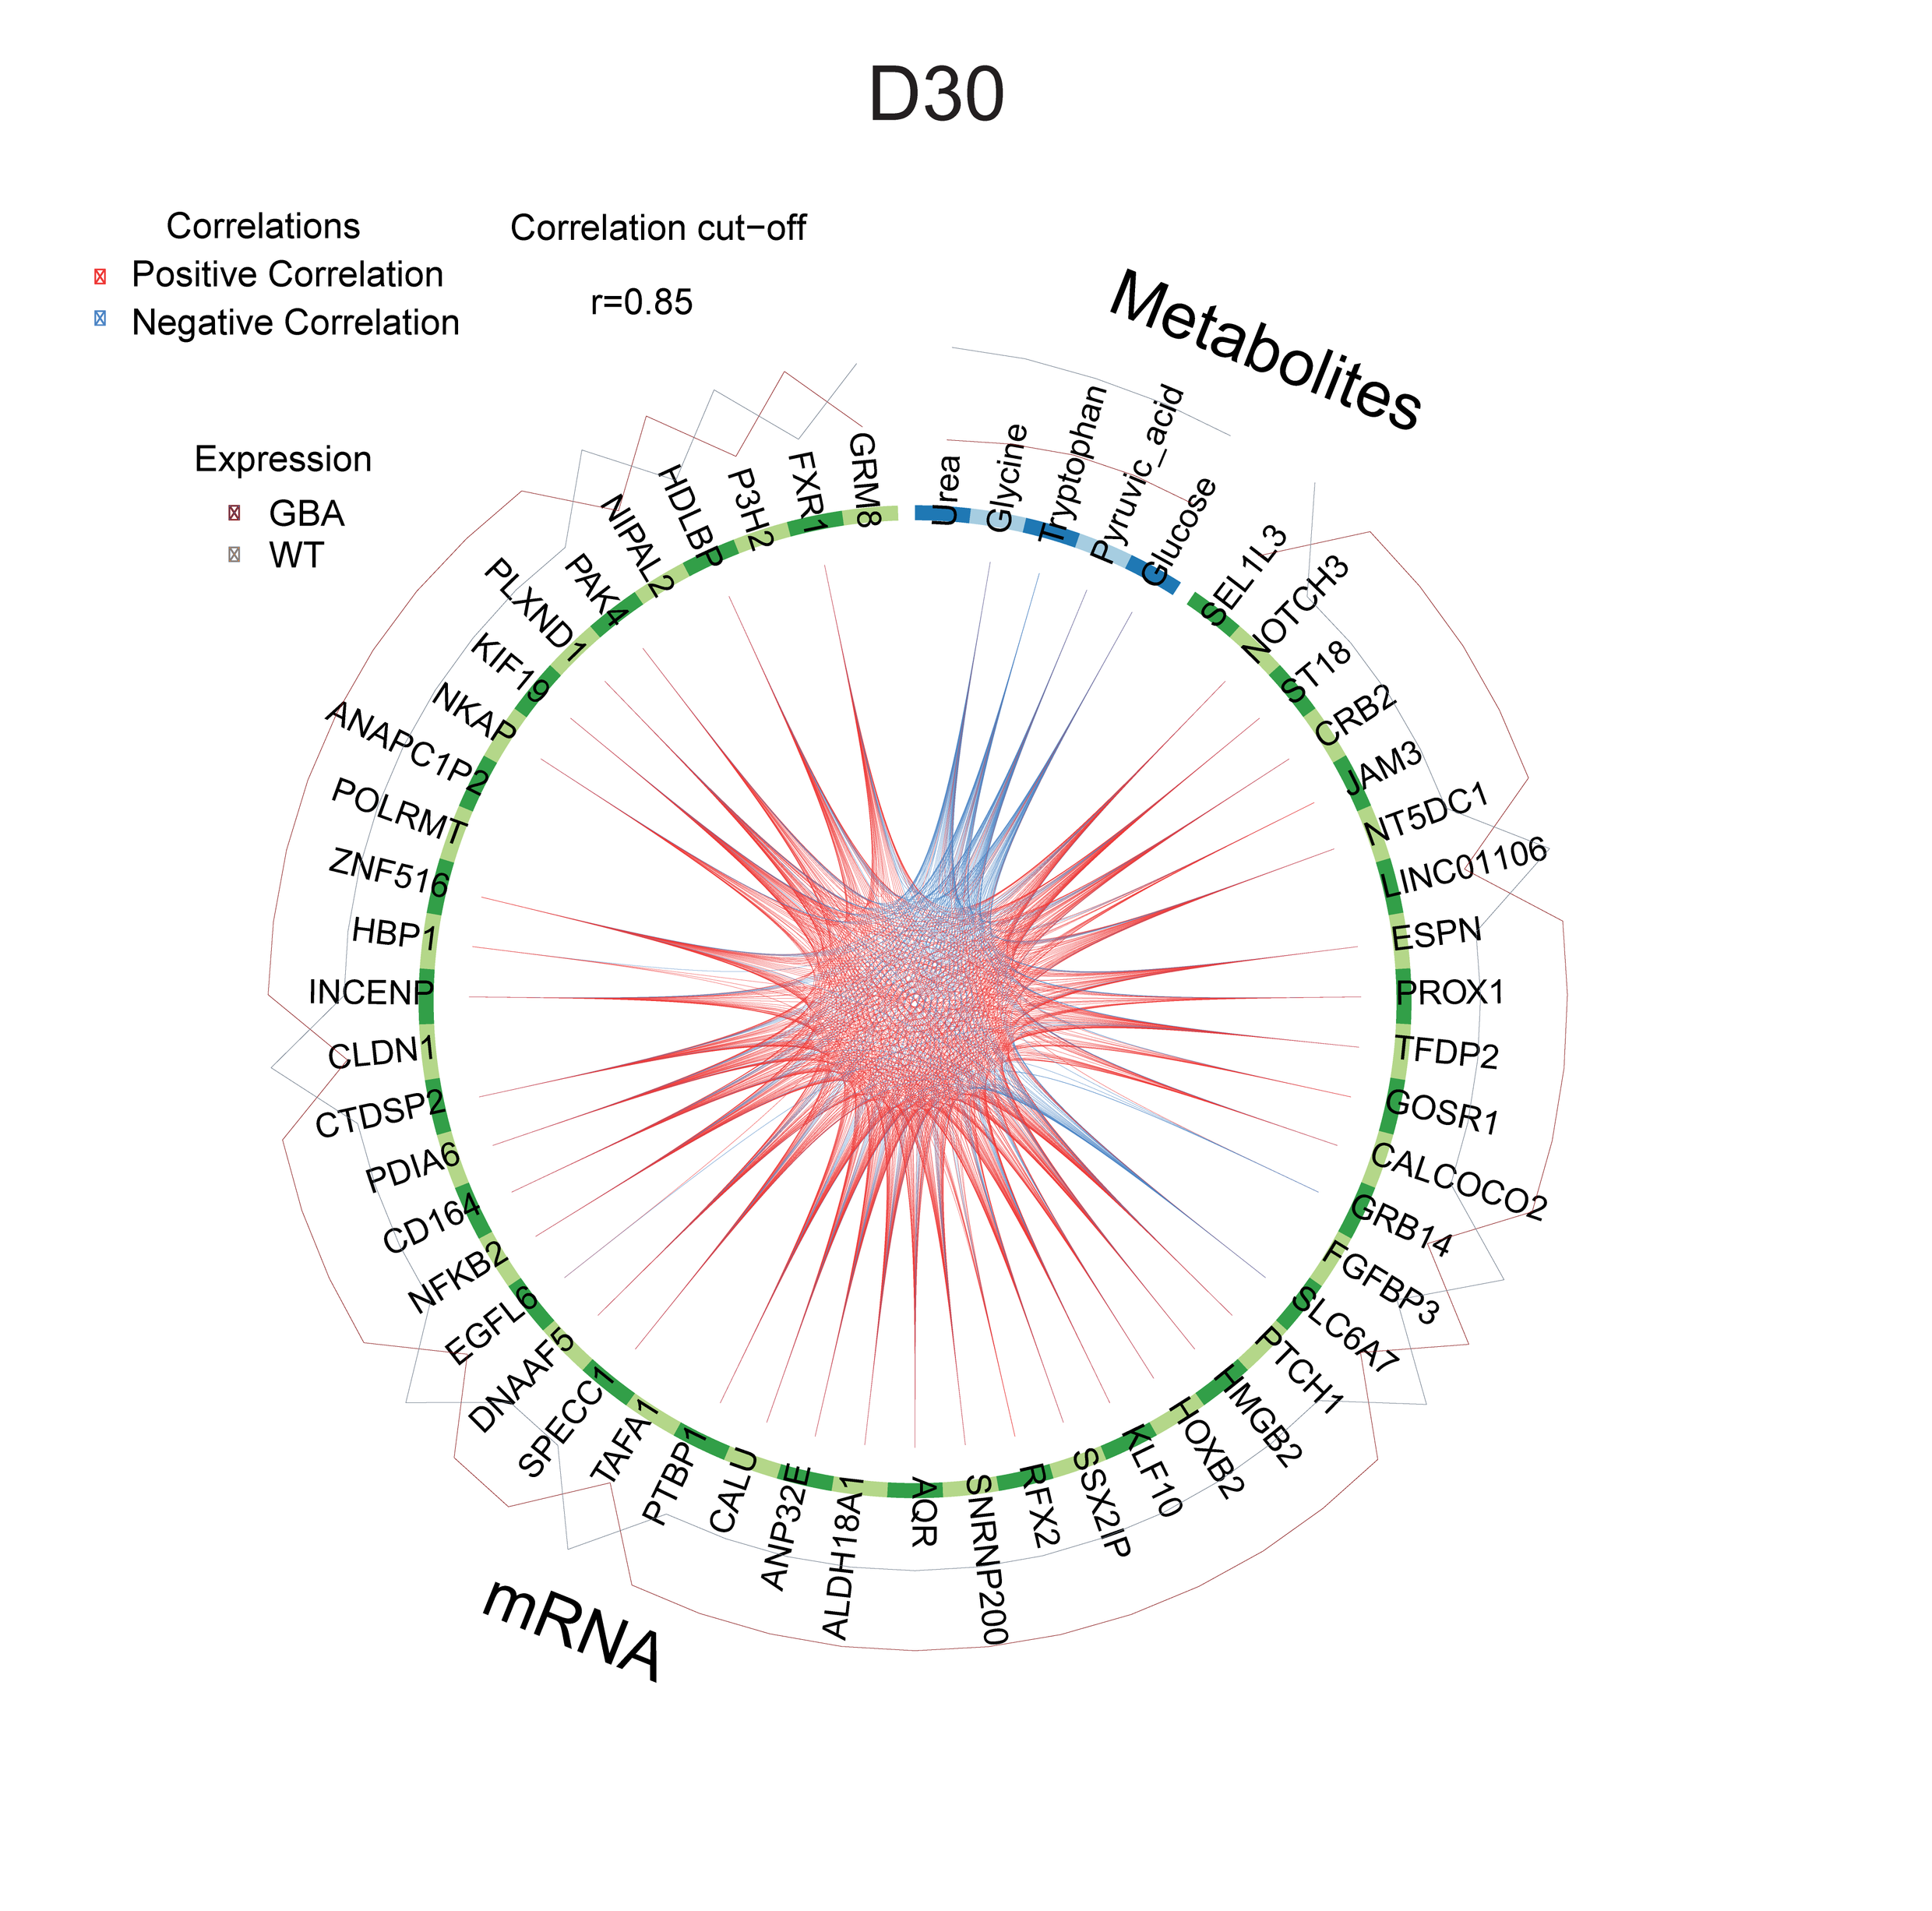
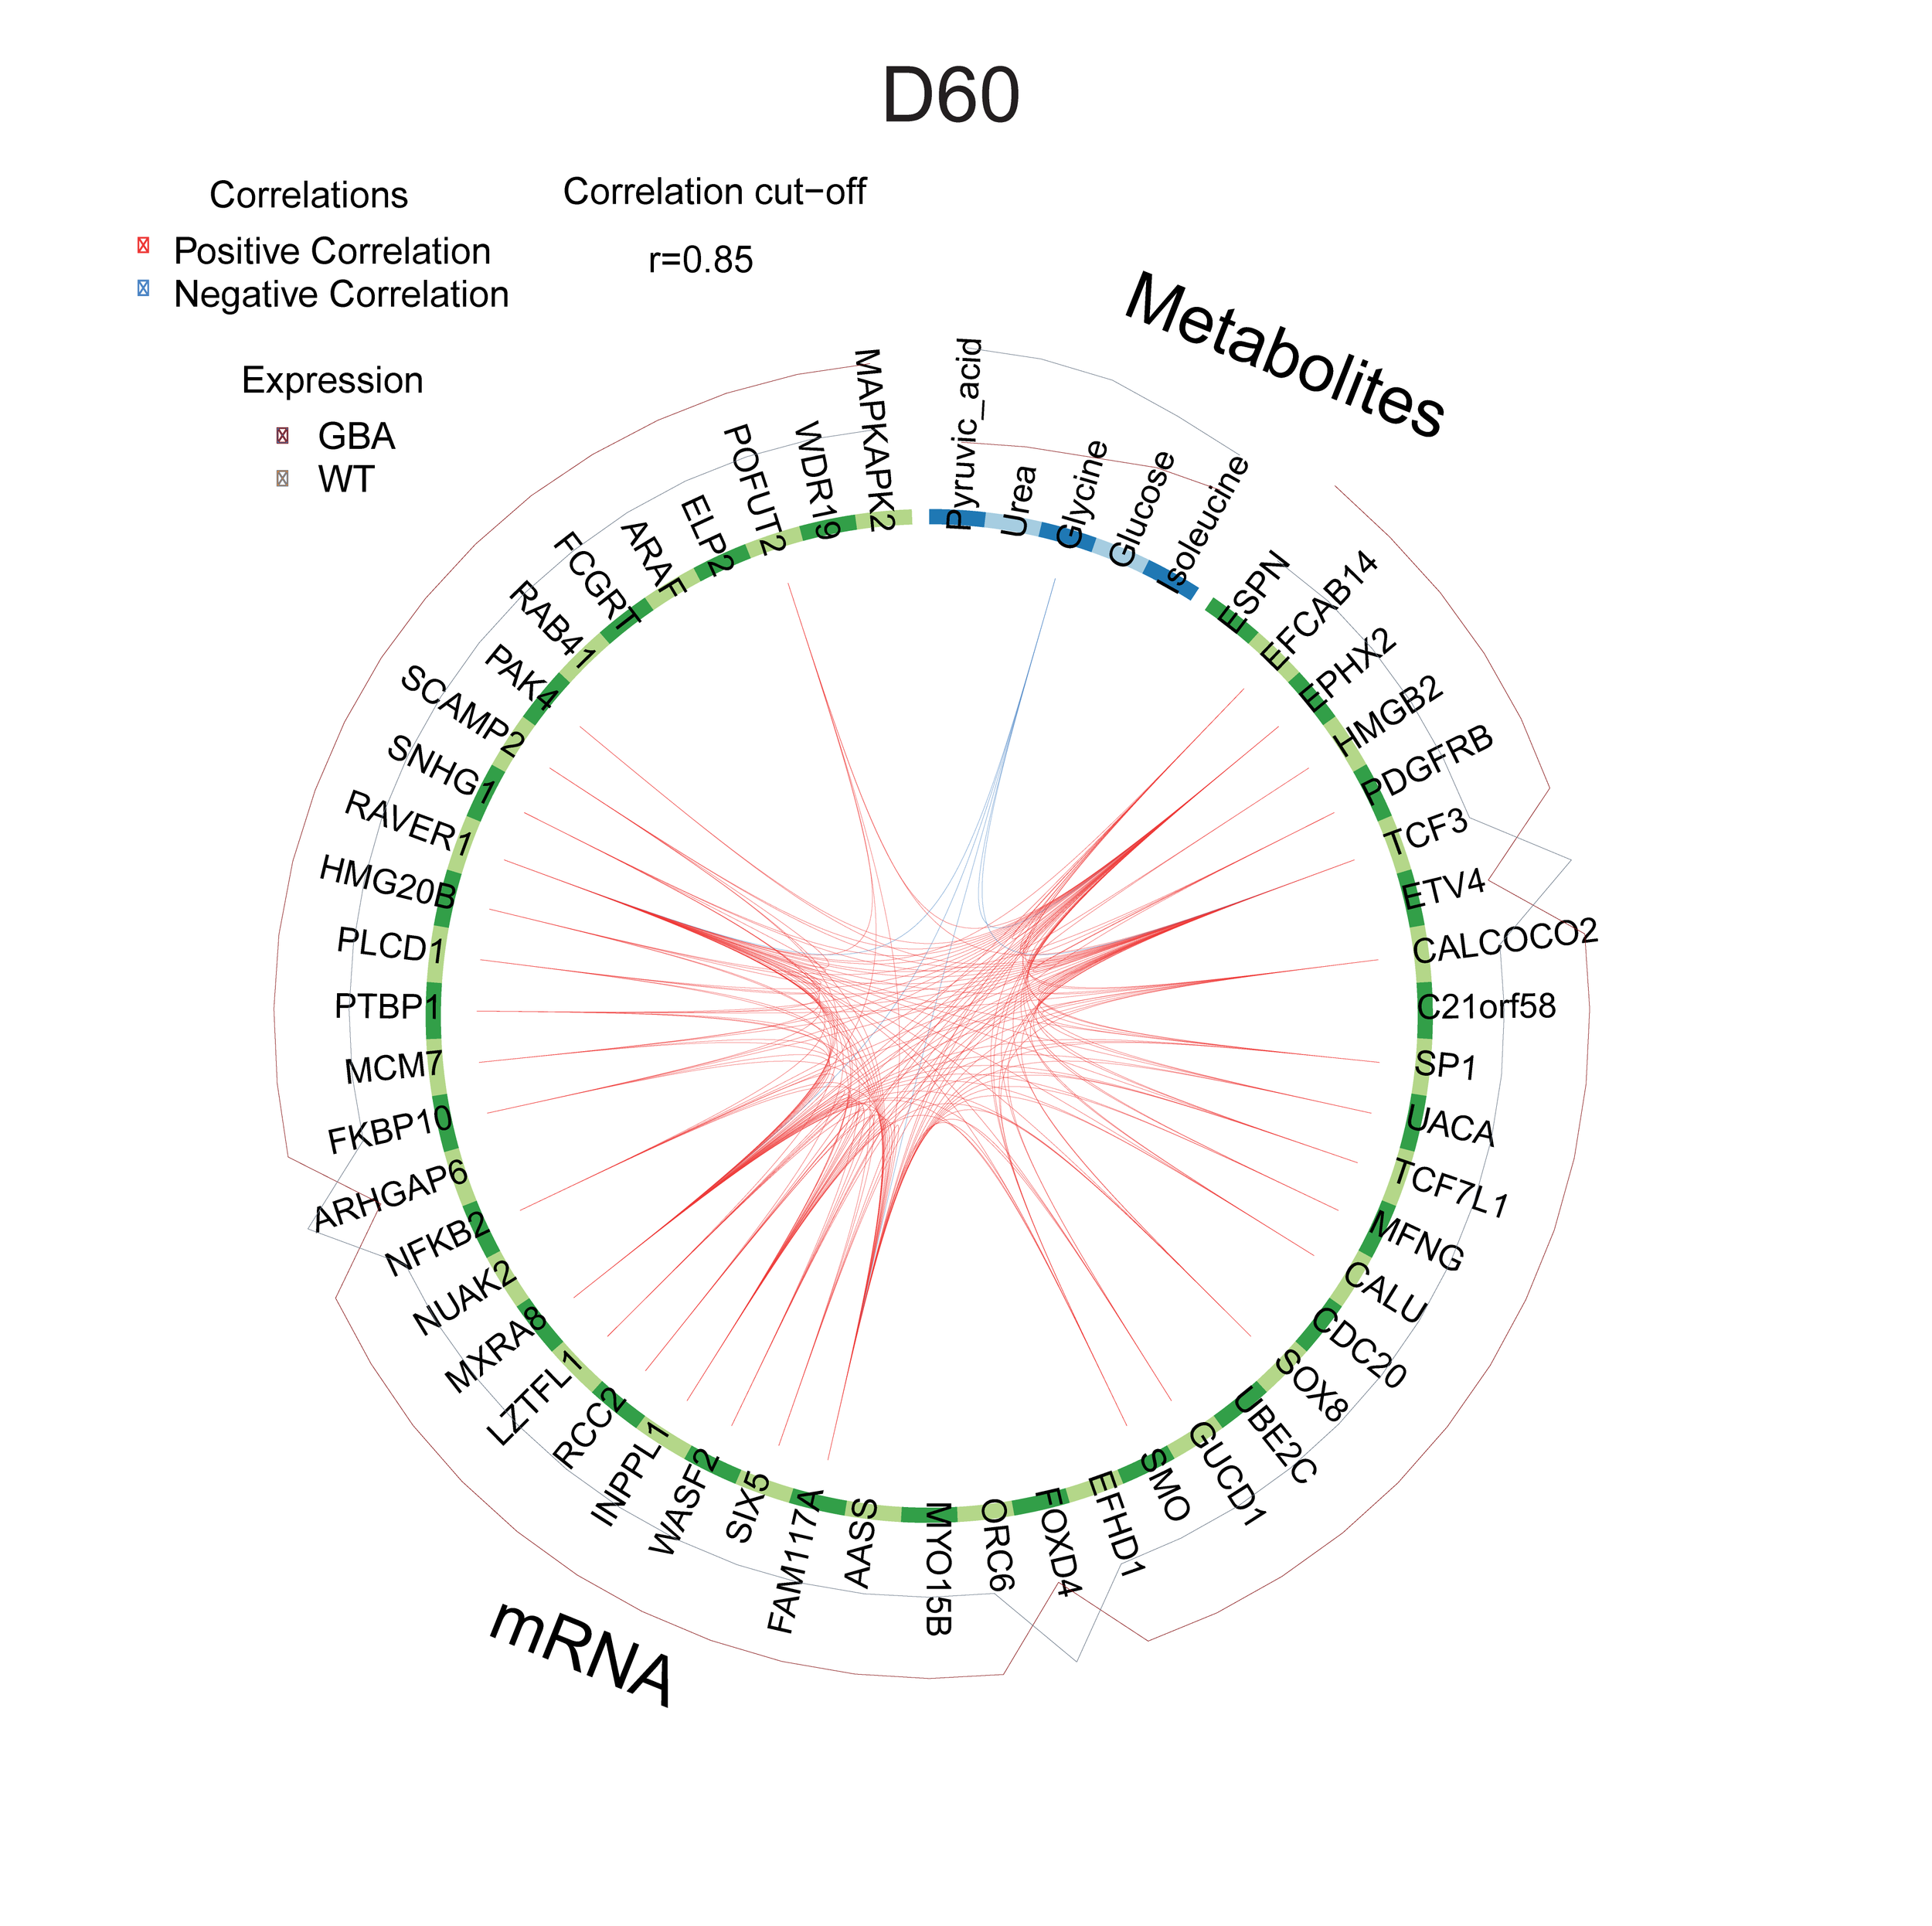
Project data integration
Experimental data coming from different assays of a project can be integrated and visualized for a better understanding of disease phenotypes and treatment effects. A full description of this pipeline can be found here.
Computational modeling
Healthy sub-network; basal conditions
PD sub-network; decreased and increased reaction flux compared to Healthy
Data from new projects can be combined with our metabolic modeling pipeline for in-depth exploration of metabolic phenotypes.
Image analysis and artificial intelligence
We use computational AI tools for deep phenotyping of our models to detect cellular defects and their rescue following compound treatments. For more details, see our publication.